MHC-I processing predictions - Tutorial
How to obtain predictions
This website provides access to predictions of antigen processing through the
MHC class I antigen presentation pathway. The goal of the prediction is to
identify MHC-I ligands, i.e. peptides that are naturally processed from their source
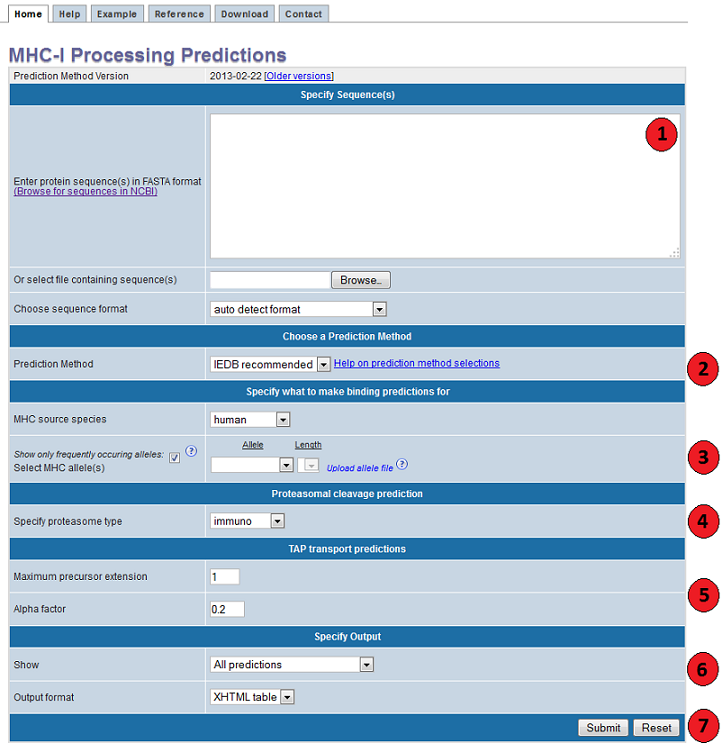
proteins and presented by MHC class I molecules. The screenshot below illustrates
the steps necessary to make a prediction.
Each of the steps is described in more detail below.

1. Specify sequences:
First specify the sequences you want to scan for MHC-I ligands. The sequences
should either be entered directly into the textarea field labeled "Enter protein sequence(s),
or can be taken from a file that has to be uploaded using the button labeled "Browse". Please
enter no more then 200 FASTA sequences or upload file size less than or equal to 10 MB per query.
The sequences can be supplied in three different formats:
All sequences have to be amino acids specified in single letter code (
The sequences can be supplied in three different formats:
- Space separated sequences
- One continuous sequence
- FASTA format
All sequences have to be amino acids specified in single letter code (
ACDEFGHIKLMNPQRSTVWY)
2. Choose a prediction method:
The prediction method list box allows choosing from a number of MHC class I binding prediction methods:
Artificial neural network (ANN),
Stabilized matrix method (SMM),
SMM with a Peptide:MHC Binding Energy Covariance matrix (SMMPMBEC),
Scoring Matrices derived from Combinatorial Peptide Libraries (Comblib_Sidney2008)
NetMHCpan,
NetMHCcons and
PickPocket.
Since 10/11/11 the IEDB team has changed the choice of recommended prediction method for the processing tool to be NetMHCpan rather than
a consensus. This is due to the processing tools requiring a quantitative IC50 value, which the consensus approach as implemented does not
supply. In addition NetMHCpan is available for all MHC alleles and has been shown to perform very well in recent comparisons. We will
continuously re-evaluate the choice for IEDB recommended mechanism.
Version method(s) used in the tool:
| Method | Version | Source |
|---|---|---|
| NetMHCpan | 3.0 | DTU |
| NetMHC (ANN) | 3.4 | DTU |
| NetMHCcons | 1.1 | DTU |
| PickPocket | 1.1 | DTU |
3. Choose an MHC binding prediction:
The MHC binding predictions used here are available in a
standalone version, and are described in more detail
here. If you are not interested in predictions for a specific MHC allele, you still have to
use these list boxes to determine the length of the MHC-I ligands of interest.
Predictions are not limited to peptides of one specific length binding to one specific allele, but multiple allele/length pairs can be submitted at a time. The allele / peptide length combination can be selected using the list boxes in this section, and can be add to a list by clicking the "Add" button. For some allele / peptide length combinations, no prediction tools exist because there is too little experimental data available to generate them. For instance, selecting an MHC source species of human will allow you to select a distinct set of MHC alleles and Peptide lengths related to the human MHC source species. Alternately, selecting a MHC source species of mouse will allow you to select a different set of MHC alleles and Peptide lengths related to the mouse MHC source species.
Selections in the listboxes in this section influence the values available in others. For example, selecting "mouse" as the MHC source species will limit the selections available in the MHC allele listbox. Similarly, the allele chosen will limit the available peptide lengths.
• Frequently occurring alleles:
By default "Show only frequently occurring alleles" check-box is checked. This allows the selection
of only those alleles that occur in at least 1% of the human population or allele frequency of 1% or higher.
However, un-checking the check-box will allow selection of all the alleles and corresponding peptide lengths
for a particular species.
• Format for the upload allele file:
File should be in simple text format containing comma separated values, where each allele is separated from it's length by a comma followed by a new line.
Therefore, you can upload a file with each line containing only one such allele-length pair(example given below). However, you may also
choose allele(s) and their length(s) from the drop-down selection in together with your uploaded file.
Example:
Example:
HLA-A*02:01,9
HLA-B*15:01,9
HLA-A*02:06,10
...
HLA-B*15:01,9
HLA-A*02:06,10
...
4. Choose a proteasomal cleavage prediction type:
There are two types of proteasomes, the constitutively expressed 'house-keeping' type, and
immuno proteasomes that are induced by IFN-γ secretion. The latter are thought to
increase the efficiency of antigen presentation. If you are unsure, select the immuno
proteasome type to make a prediction. The predictions are based on in vitro
proteasomal digests of the enolase and casein proteins as described
here.
Species Warning
Please note that both the proteasome and TAP predictions were developed using experimental
data for human versions of the molecule. At least for TAP molecules, there are known to be
some species dependent differences in specificity. Therefore, using these predictions for eptitope
processing in non-human cells should only be done with extra caution in interpreting results.
5. Specify TAP prediction parameters:
The TAP score estimates an effective -log(IC50) values for the binding to TAP of a peptide or its N-terminal prolonged
precursors. It has been show that high affinity of a peptide translates into high transport rates. Note that the original
reference used +ln(IC50) values (ln = natural logarithm instead of log = base 10). The calculation of the score remains unchanged.
6. Specify the output:
The menus in this section change how the prediction output is displayed. Using the
"Sort peptides by" listbox, the results can be presorted by the order of the peptides
in their source sequence (default) or by their predicted scores. Use the listbox to
specify which score to sort by.
To limit the number of results displayed, which can significantly speed up the time it takes to make a prediction, it is possible to define a lower boundary for the prediction in the "cutoff" field. The listbox preceding the "cutoff" field selects which prediction the cutoff is applied to.
To reuse the prediction results in an external program, it is possible to retrieve the predictions in a plain text format. To do this, choose "Text file" in the output format listbox.
7. Submit the prediction:
This one is easy. Click the submit button, and a result screen similar to
the one below should appear.
Interpreting prediction output
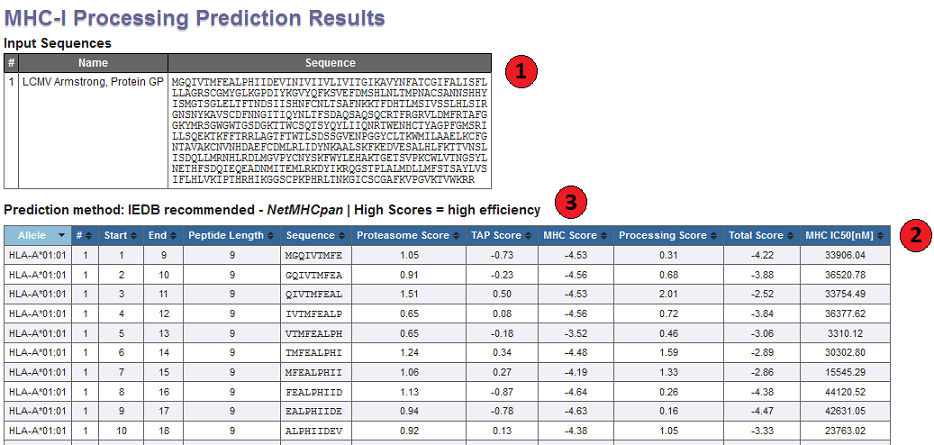
Below is a screenshot of a prediction output page, with three relevant sections
marked that are described in more detail below.

1. Input Sequences:
This table displays the sequences and their names extracted from the user input.
If no names were assigned by the user (which is only possible in FASTA format),
the sequences are numbered in their input order (sequence 1, sequence 2, ...).
2. Prediction output table:
Each row in this table corresponds to one peptide binding prediction. The columns contain the allele the
prediction was made for, the input sequence number (#), start position and end position of the peptide,
its length, the peptide sequence and the predicted scores, which includes proteasome score, TAP score,
MHC score, processing score, total score and IC50 score. The table can be sorted by clicking on the
table column headers.
3. Interpreting prediction scores:
The three primary prediction scores are:
- Proteasome cleavage - The scores can be interpreted as logarithms of the total amount of cleavage site usage liberating the peptide C-terminus. Obviously this should not be taken literally as it depends on a lot of other factors e.g. the amount of source protein degraded. However all other things being equal, the difference between two scores can thus be translated into a difference of amounts.
- TAP transport - The TAP score estimates an effective -log(IC50) values for the binding to TAP of a peptide or its N-terminal prolonged precursors. It has been show that high affinity of a peptide translates into high transport rates. Note that the original reference used +ln(IC50) values. The calculation of the score remains unchanged.
- MHC binding - The MHC binding prediction is identical to the Class-I and described in more detail here. However, the output is not log(IC50) values, but -log(IC50) values. The sign change was introduced for consistency purposes: now all scores associate higher values with higher predicted efficiency.
In addition to the individual scores, two summary scores are calculated:
- Processing - this score combines the proteasomal cleavage and TAP transport predictions. It predicts a quantity proportional to the amount of peptide present in the ER, where a peptide can bind to multiple MHC molecules. This allows predicting T-cell epitope candidates independent of MHC restriction.
- Total - this score combines the proteasomal cleavage, TAP transport and MHC binding predictions. It predicts a quantity proportional to the amount of peptide presented by MHC molecules on the cell surface.