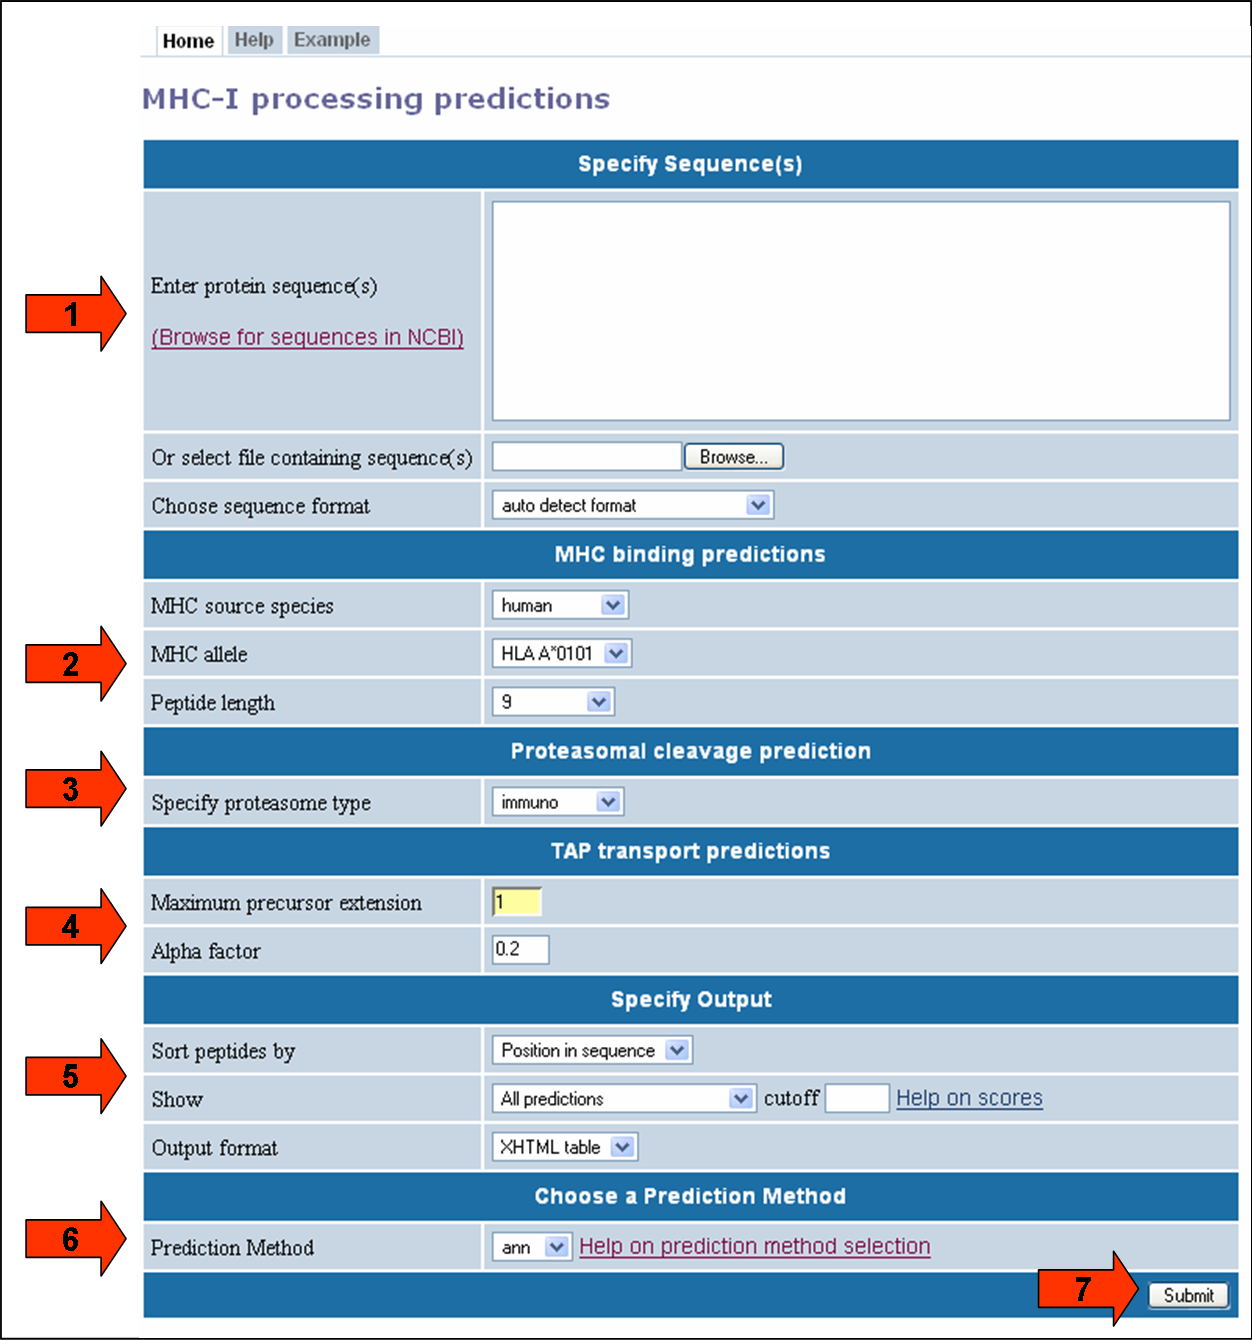
This website provides access to predictions of antigen processing through the MHC class I antigen presentation pathway. The goal of the prediction is to identify MHC-I ligands, i.e. peptides that are naturally processed from their source proteins and presented by MHC class I molecules. The screenshot below illustrates the steps necessary to make a prediction. Each of the steps is described in more detail below.
First specify the sequences you want to scan for MHC-I ligands. The sequences should either be entered directly into the textarea field labeled "Enter protein sequence(s), or can be taken from a file that has to be uploaded using the button labeled "Browse".
The sequences can be supplied in three different formats:
The format of the sequences can be specified explicitly using the list box labeled "Choose sequence format". If that list box is set to "auto detect format", the input will be interpreted as FASTA if an opening ">" character is found, or as a continuous sequence otherwise.
All sequences have to be amino acids specified in single letter code (ACDEFGHIKLMNPQRSTVWY)
The MHC binding predictions used here are available in a standalone version, and are described in more detail here. If you are not interested in predictions for a specific MHC allele, you still have to use these list boxes to determine the length of the MHC-I ligands of interest.
There are two types of proteasomes, the constitutively expressed 'house-keeping' type, and immuno proteasomes that are induced by INF-γ secretion. The latter are thought to increase the efficiency of antigen presentation. If you are unsure, select the immuno proteasome type to make a prediction. The predictions are based on in vitro proteasomal digests of the enolase and casein proteins as described here.
Please note that both the proteasome and TAP predictions were developed using experimental data for human versions of the molecule. At least for TAP molecules, there are known to be some species dependent differences in specificity. Therefore, using these predictions for eptitope processing in non-human cells should only be done with extra caution in interpreting results.
Modify these parameters only if you want to fine-tune the TAP transport prediction. In that case, it is advisable to first read the original reference.
Briefly, the TAP predictions output an average transport efficiency of a peptide and its N-terminally prolonged precursors. The parameters here allow changing the expected length frequency of such precursors. The "alpha" parameter down weights the contribution of the N-terminal residues to the TAP score. The "extension of precursors" parameter specifies the number of residues precursors can be extended beyond he presented epitope.
Please note the Species Warning above.
The menus in this section change how the prediction output is displayed. Using the "Sort peptides by" listbox, the results can be presorted by the order of the peptides in their source sequence (default) or by their predicted scores. Use the listbox to specify which score to sort by.
To limit the number of results displayed, which can significantly speed up the time it takes to make a prediction, it is possible to define a lower boundary for the prediction in the "cutoff" field. The listbox preceding the "cutoff" field selects which prediction the cutoff is applied to.
To reuse the prediction results in an external program, it is possible to retrieve the predictions in a plain text format. To do this, choose "Text file" in the output format listbox.
This one is easy. Click the submit button, and a result screen similar to the one below should appear.
Below is a screenshot of a prediction output page, with three relevant sections marked that are described in more detail below.
This table displays the sequences and their names extracted from the user input. If no names were assigned by the user (which is only possible in FASTA format), the sequences are numbered in their input order (sequence 1, sequence 2, ...).
Each row in this table corresponds to one peptide prediction. The columns contain the allele the prediction was made for, the position of the peptide in the input sequences (in the format [Sequence #]: [Start Position] - [End Position]), the length of the peptide, the peptide sequence and the predicted scores. The table can be sorted by clicking on the column headers.
The three primary prediction scores are:
In addition to the individual scores, two summary scores are calculated:
A detailed evaluation of the correlation between predicted scores and antigenicity of peptides is currently being conducted and will help to better interpret prediction results.