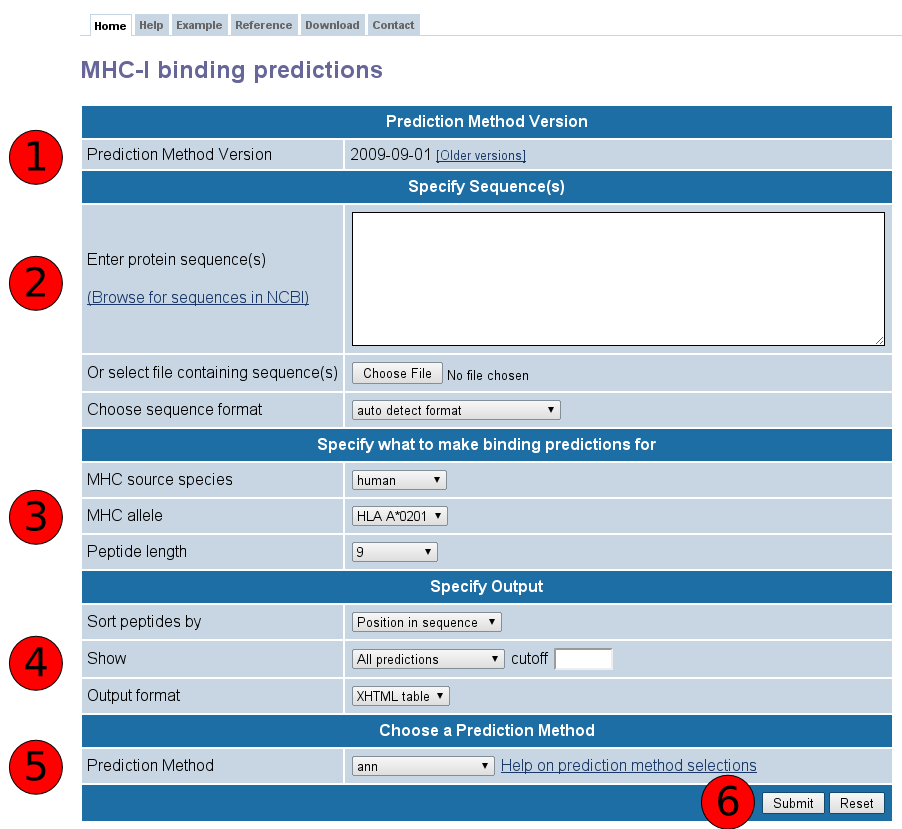
This website provides access to predictions of peptide binding to MHC class I molecules. The screenshot below illustrates the steps necessary to make a prediction. Each of the steps is described in more detail below.
The provided date indicates when the tools were released.
First specify the sequences you want to scan for binding peptides. The sequences should either be entered directly into the text area field labeled "Enter protein sequence(s), or can be taken from a file that has to be uploaded using the button labeled "Browse".
The sequences can be supplied in three different formats:
The format of the sequences can be specified explicitly using the list box labeled "Choose sequence format". If that list box is set to "auto detect format", the input will be interpreted as FASTA if an opening ">" character is found, or as a continuous sequence otherwise.
All sequences have to be amino acids specified in single letter code (ACDEFGHIKLMNPQRSTVWY)
Predictions are limited to peptides of one specific length binding to one specific allele at a time. The allele / peptide length combination can be selected using the list boxes in this section. For some allele / peptide length combinations, no prediction tools exist because there is too little experimental data available to generate them. For instance, selecting an MHC source species of human will allow you to select a distinct set of MHC alleles and Peptide lengths related to the human MHC source species. Alternately, selecting a MHC source species of mouse will allow you to select a different set of MHC alleles and Peptide lengths related to the mouse MHC source species.
Selections in the listboxes in this section influence the values available in others. For example, selecting "mouse" as the MHC source species will limit the selections available in the MHC allele listbox. Similarly, the allele chosen will limit the available peptide lengths.
The menus in this section change how the prediction output is displayed. Using the "Sort peptides by" listbox, the results can be presorted by the order of the peptides in their source sequence (default) or by their predicted affinity.
To limit the number of results displayed, which can significantly speed up the time it takes to make a prediction, it is possible to define an upper boundary for the prediction in the "cutoff" field. Note that the listbox preceding the "cutoff" field has to be set to "Predicted IC50 [nM] " for the cutoff to take effect.
To reuse the prediction results in an external program, it is possible to retrieve the predictions in a plain text format. To do this, choose "Text file" in the output format listbox.
The prediction method list box allows choosing from a number of MHC class I binding prediction methods: Artificial neural network (ANN), Average relative binding (ARB), Stabilized matrix method (SMM), SMM with a Peptide:MHC Binding Energy Covariance matrix (SMMPMBEC), Scoring Matrices derived from Combinatorial Peptide Libraries (Comblib_Sidney2008), and Consensus.
We have conducted a large scale evaluation of the performance of the MHC class I binding predictions and found that they in general rank as 1) ANN method 2) SMM method and 3) ARB. Supplementary information, including all datasets used to establish and evaluate the methods, is available here.
By default, the overall best method (ANN) is selected. However, not all methods can currently make predictions for all allele and peptide length combinations, so only the methods available will be displayed.
As of September 1st 2009, the tools have been trained on the new set of peptide binding data that became recently available. Thus, predictions made using the new tools may be different from those of the old tools.
This one is easy. Click the submit button, and a result screen similar to the one below should appear.
Below is a screenshot of a prediction output page, with four relevant sections marked that are described in more detail below.
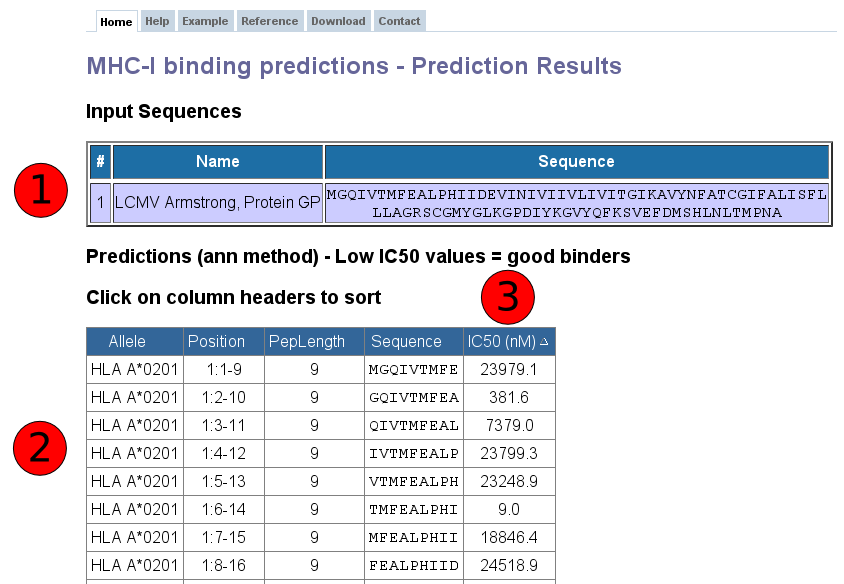
This table displays the sequences and their names extracted from the user input. If no names were assigned by the user (which is only possible in FASTA format), the sequences are numbered in their input order (sequence 1, sequence 2, ...).
Each row in this table corresponds to one peptide binding prediction. The columns contain the allele the prediction was made for, the position of the peptide in the input sequences (in the format [Sequence #]: [Start Position] - [End Position]), the length of the peptide, the peptide sequence and the predicted affinity. The table can be sorted by clicking on the table column headers.
The predicted output is given in units of IC50nM. Therefore a lower number indicates higher affinity. As a rough guideline, peptides with IC50 values <50 nM are considered high affinity, <500 nM intermediate affinity and <5000 nM low affinity. Most known epitopes have high or intermediate affinity. Some epitopes have low affinity, but no known T-cell epitope has an IC50 value greater than 5000.
While the output of the predictions is quantitative, there are systematic deviations from experimental IC50 values. For example, the makeup of the training data and the prediction methods used have a non-trivial impact on the range of predicted IC50 values. A detailed evaluation of the correlation between predicted IC50 and antigenicity of peptides is currently being conducted which will help to better interpret prediction results.