Epitope Conservancy Analysis - Tutorial
Tutorial
This tool computes the degree of conservancy of an epitope within a given protein sequence set at a given identity level. Conservancy is defined as the fraction of protein
sequences that contain the epitope, and Identity is the degree of correspondence (similarity) between two sequences. Two types of calculations are available:
1) Linear and 2) Discontinuous epitope sequence conservancy analyses.
How to use the tool
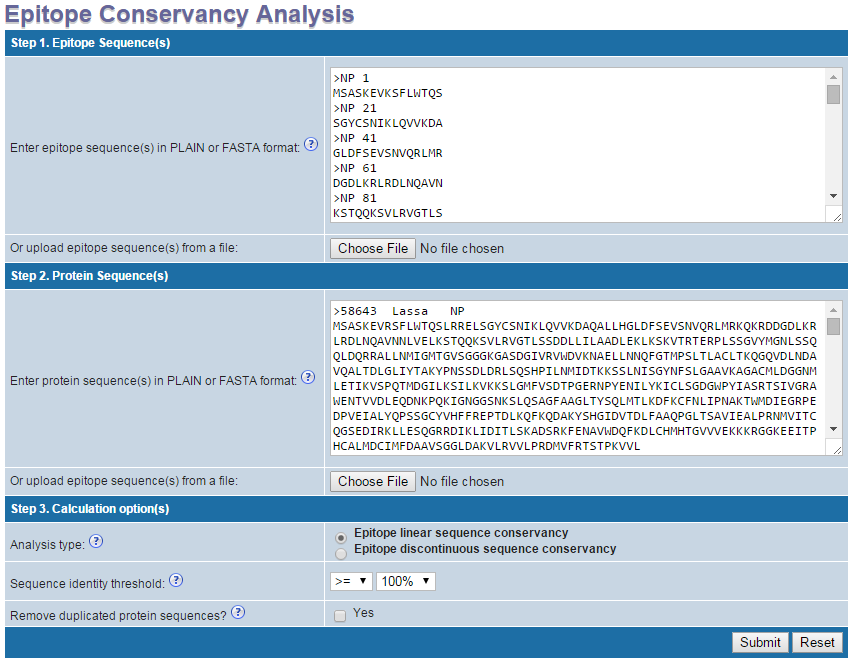
Step 1. Specify epitope sequences
Epitope sequences can be either directly entered in the text area or upload from a file. To upload data from a file, click the "Browse" button to select a file, then click "Click here
to upload" button. File content will then be shown in the text area. Two acceptable sequence formats are PLAIN and FASTA. A sequence in PLAIN format is separated by a new line. A sequence in
FASTA format begins with a single-line description, followed by line(s) of sequence data. The description line is distinguished
from the sequence data by a greater-than (">") symbol in the first column. Two acceptable types of epitopes are Linear and Discontinuous. Linear
epitopes are specified as amino acid single-letter code sequences. Discontinuous epitopes are specified as alphanumeric residues separated by commas. A minimum of 3 residues for a
discontinuous epitope sequence must be specified for calculation.
- Example of a linear epitope sequence: MSASKEVKSFLWTQS
- Example of a discontinuous sequence: S1,C4,S5,I7,K8
Step 2. Specify protein sequences
Protein sequences can be either directly entered in the text area or upload from a file. To upload data from a file, click the "Browse" button to select a file, then click "Click here
to upload" button. File content will then be shown in the text area. Two acceptable sequence formats are PLAIN and FASTA. A sequence in PLAIN format is separated by a new line. A sequence in
FASTA format begins with a single-line description, followed by line(s) of sequence data. The description line is distinguished
from the sequence data by a greater-than (">") symbol in the first column. Only linear amino acid single-letter codes sequences are accepted.
Example of a linear protein sequence: MSASKEVRSFLWTQSLRRELSGYCSNIKLQVVKDAQALLHGLDFS
To obtain FASTA protein sequences for a given organism, click on "browse for sequences in NCBI" link and follow the screen instructions.
Step 3. Specify calculation options
- Analysis type: Select either "Epitope linear sequence conservancy" for Linear epitope sequences or "Epitope discontinuous sequence conservancy" for Discontinuous epitope sequences entered in step 1.
- Sequence identity threshold: Select the identity threshold at which you want to calculate epitope conservancy. Furthermore one can chose to display calculated conservancies ">=" or "<" than the selected sequence identity threshold.
- Remove duplicated protein sequences?: check the box (Yes) if you want the tool to remove duplicated sequences in the protein sequence set entered in step 2 before calculation.
Step 4. Submission
Click "Submit" to start calculation or "Reset" to clear input parameters.
Example input

How the results are presented
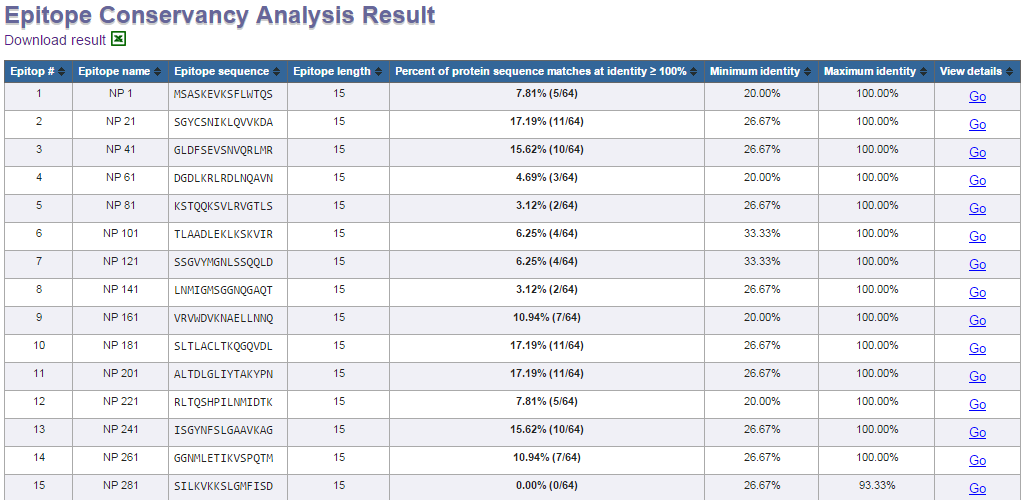
Calculation results are presented in a summary view (for all epitope sequences) and a detail view (for individual epitope). The summary view shows for each epitope, the calculated degree of
conservancy (percent of protein sequence matches a specified identity level) and the matching minimum/maximum identity levels within the protein sequence set. To view the detail sequence
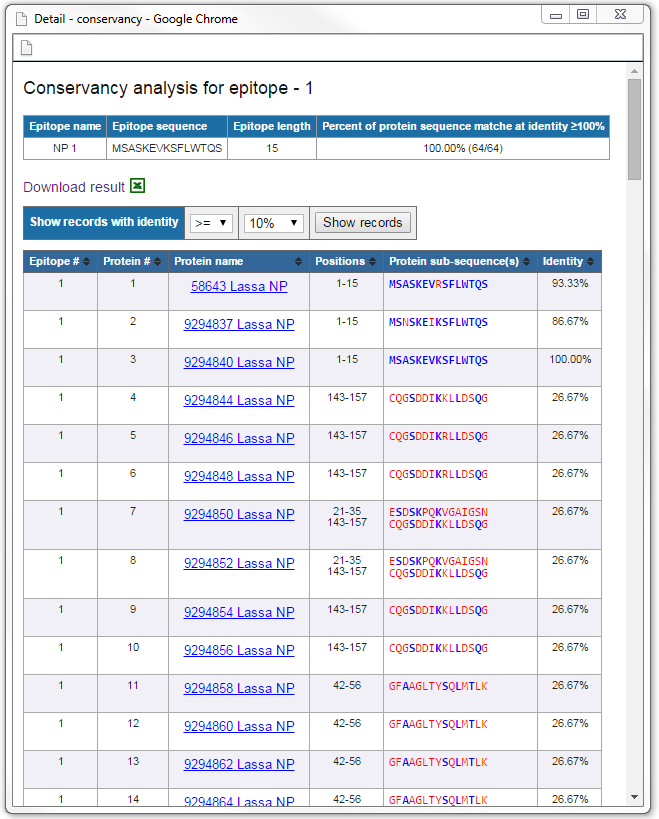
mapping of each epitope, click on the "Go" link in the "View details" column. The detail view of an epitope shows the positions and the matching protein sub-sequences
for all sequences in the protein data set. The corresponding matching identity level of the epitope in each protein sequence is also displayed. All the calculated results can be saved to a
file by clicking on the "Download data to file" button.
Example summary view

Example detail view

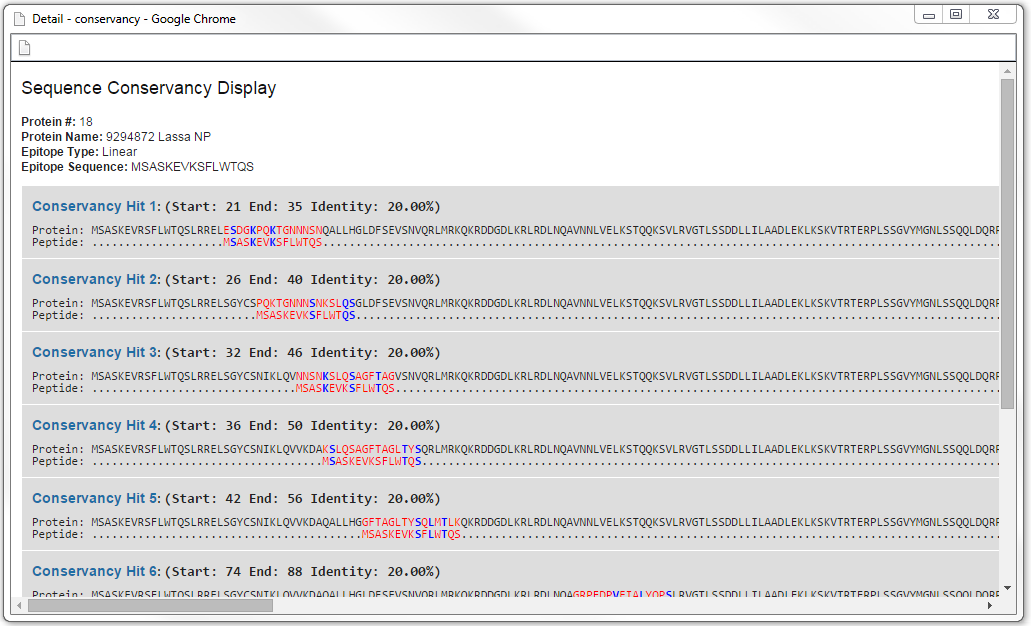
Sequence conservancy view
From the detail view one can view the actual sequence conservancy as an alignment by clicking the link in the "Protein name" column.
