Epitope Cluster Analysis - Tutorial
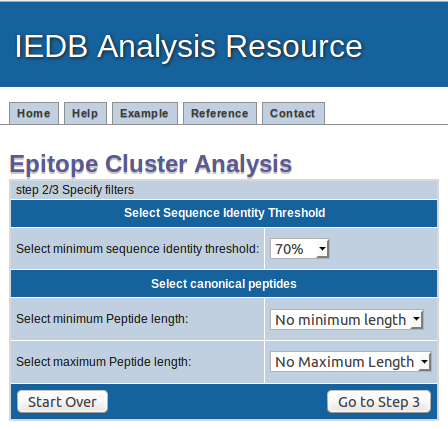
This tool groups epitopes into clusters based on sequence identity. A cluster is defined as a group of sequences which have a sequence
similarity greater than the minimum sequence identity threshold specified.
* Please note that certain datasets are known to cause different clusters to form between runs of the tool and it's an issue that is actively being investigated.
How to use the tool
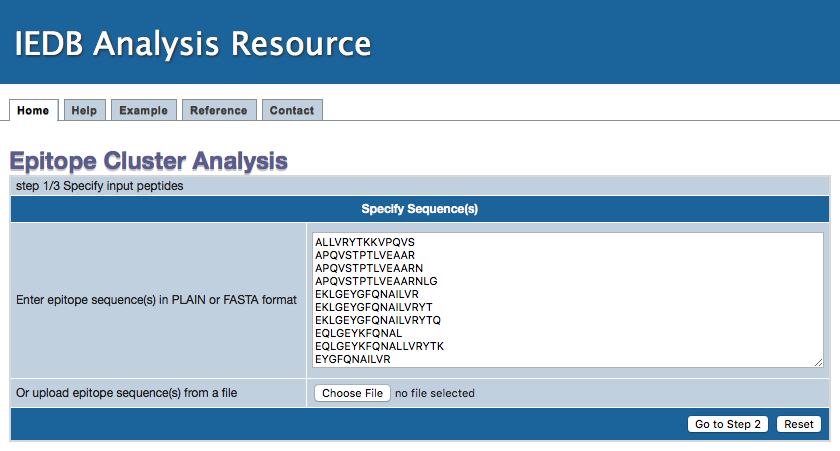
1. Specify epitope sequences
Epitope sequences can be either directly entered in the text area or uploaded from a file. To upload data from a file, click the "Browse" button
to select a file. File content will then be shown in the text area. Two acceptable sequence formats are PLAIN and FASTA. A sequence in PLAIN format
is separated by a new line. A sequence in
FASTA format begins with a
single-line description, followed by line(s) of sequence data. The description line is distinguished from the sequence data by a greater-than
(">") symbol in the first column.
Step 1 Example input
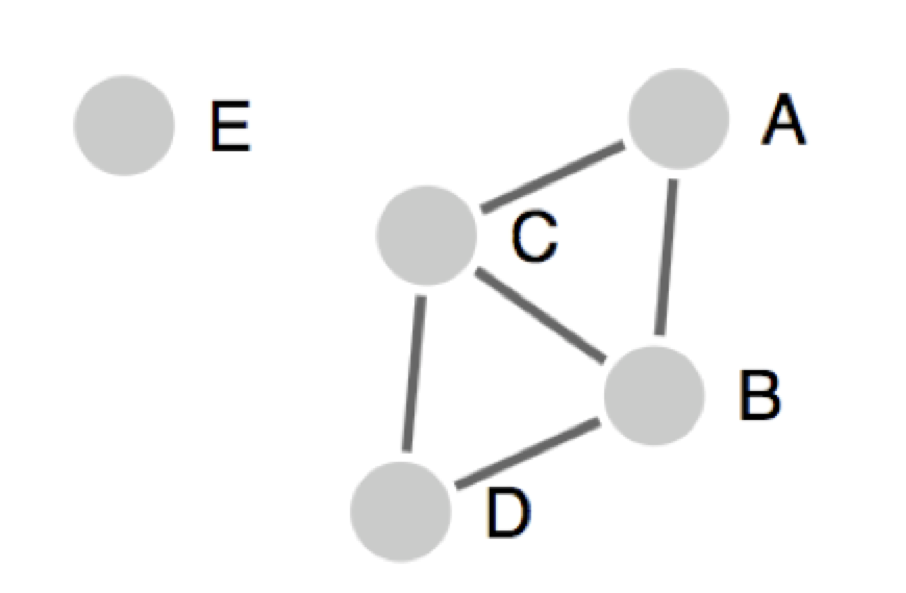
In this presentation, peptides are presentated as circles and the solid line connecting two peptides is identity above specified threshold. Here, A, B, C, D and E are five pepitde sequences. Singlestons are isolated peptides (like peptide E in the above figure), those peptides don't share sequence identity with any other peptides in the given data.
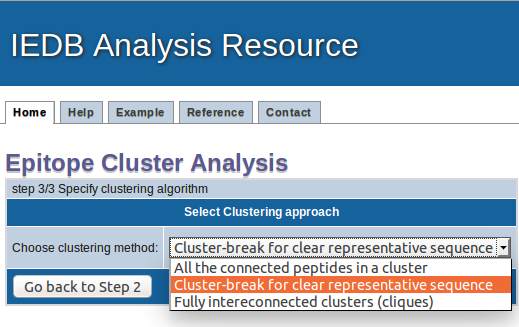
1. All the connected peptides in a clusters: Here, all the peptides that are homologous to a certain pre specified level are clustered together, say for example at the 70% level. In this case any member of the cluster will be at least 70% homologous to at least one member of the cluster. However, the approach's drawback is that members of the cluster might and often are related by levels of homology much lower than 70%. As as result, the cluster may not give a clear consensus sequence.
Therefore, using this approach, in the above presentation; A, B, C and D will make one cluster and E will be presented as islated peptide.
Here, A and D are not directly connected, but these peptide will be a part of same cluster.
2. Cluster-break for clear representative sequence (Recommended): This is an extention of first approach, where a cluster is broken down into subclusters at a point, so that each subcluster can give a representative sequence. No peptide will be present in two clusters/sub-clusters.
Therefore, using this approach, in the above presentation; A, B, C and D will make one cluster, but these peptides can have different sub-clusters to give clean representative sequence. E will be presented as islated peptide.
3. Fully interconnected clusters (cliques): This is an alternative approach, where all the peptides in a clusters are fully interconnected and share homology more than the given threshold. These fully interconnected clusters are called as cliques. Here, one peptide can be a part of multiple cliques.
Therefore, using this approach, in the above presentation; A, B, C will make one clique and B, C, D will make second clique.
Please note that B and C will be a part of both clique in this case.
E will be presented as islated peptide.
How the results are presented
Clusters are displayed in a table format where clusters are indicated by table rows which have the same color. All calculated cluster results can be
saved to a file by clicking on the "Download data to file" button.
Example result table view
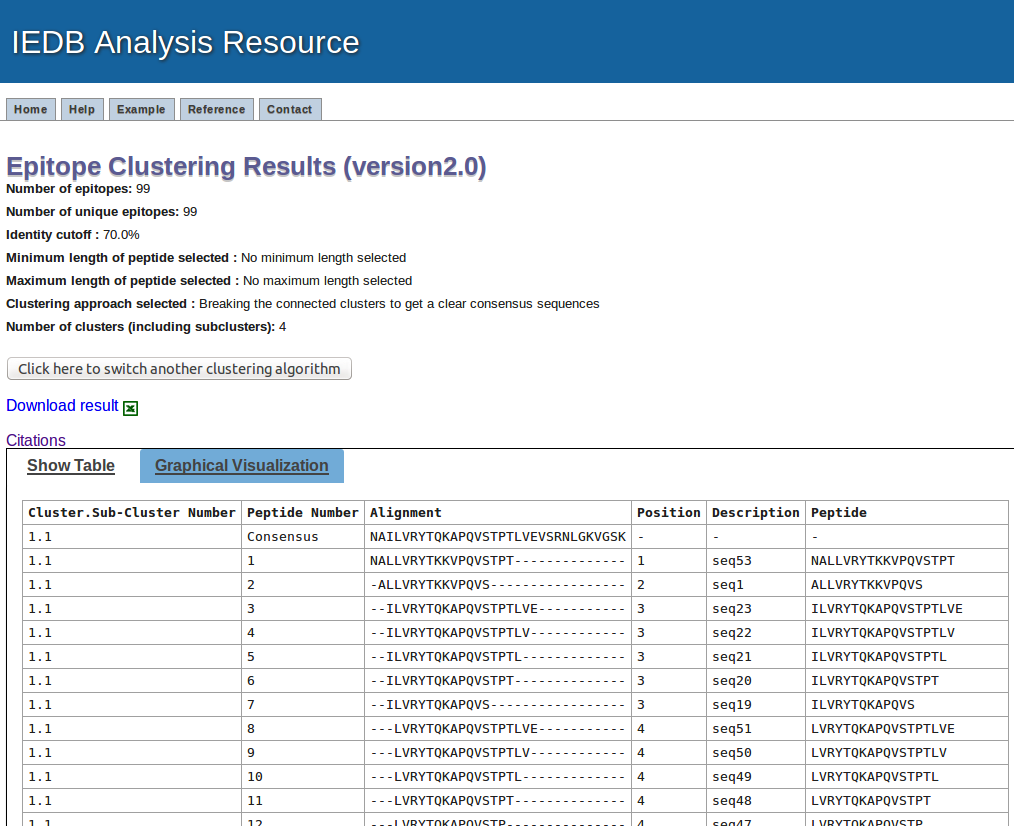
The first paragraph in the resulte page will summarize the input parameters
This output will present the result in tablular format and the results are sorted based on the cluster numbers. All the subclusters are given number with major clusters. Like 1.1, 1.2, 1.3 etc. are the sub-clusters broken down from common parental clusters.
The next column present the numbering of the peptides in each cluster/sub-cluster/clique, where first row in each cluster/sub-cluster/clique will be representative or consensus sequence
The next column is displaying the aligment of the peptides in that cluster
The position column shows the position of peptides in consensus or representative sequence.
The description column shows the peptide number in given data, if input is given in plain format. If the input data is given in fasta format, it will display the description given in fasta format.
The last column is peptide sequence.
The link for downlaod is given at the start and end of the table.
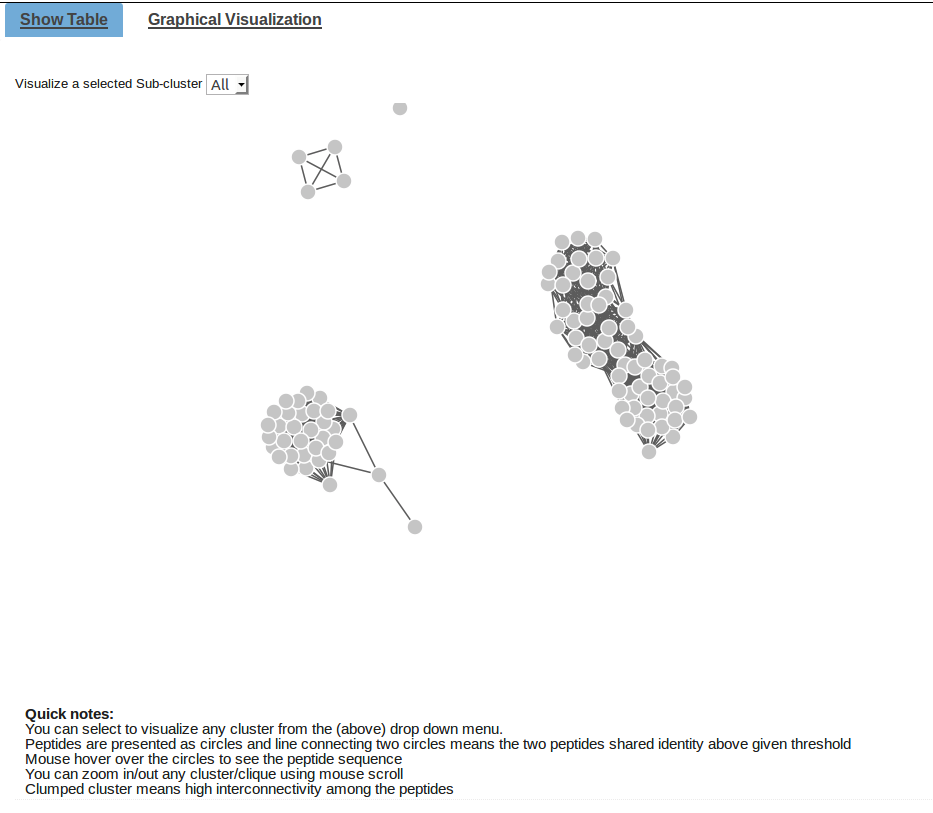
Example result visualization
On default settings, all the clusters/cliques will be visualized, but user can select any cluster to visualize.
The peptides can be visualize here with mouse hover.
It also has the facility to zoom-in and zoom-outs.
Please note that the visualization may be very fuzzy with large datasets.